pygmt.params.Axis

class pygmt.params.Axis(annot=False, tick=False, grid=False, label=None, prefix=None, unit=None, angle=None)[source]

Class for setting up one axis of a plot.

Examples

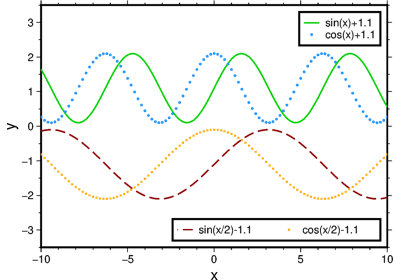
To specify the same attributes for x- and y-axes, with intervals of 4 for annotations, 2 for ticks, and 1 for gridlines:

>>> import pygmt
>>> fig = pygmt.Figure()
>>> fig.basemap(
...     region=[0, 10, 0, 20],
...     projection="X10c/10c",
...     frame=Axis(annot=4, tick=2, grid=1),
... )
>>> fig.show()
annot: float | str | bool = False

Specify the interval for annotations. It can be True to let GMT decide the interval automatically; or a value to set a specific interval in the format of stridephase][unit], where, stride is the interval, phase is the offset to shift the annotations by that amount, and unit is one of the 18 supported unit codes related to time intervals.

tick: float | str | bool = False

Specify the interval for ticks. Same format as annot.

grid: float | str | bool = False

Specify the interval for gridlines. Same format as annot.

label: str | None = None

Label for the axis [Default is no label].

prefix: str | None = None

A leading text prefix for the axis annotations (e.g., dollar sign for plots related to money) [For Cartesian plots only].

unit: str | None = None

Unit to append to the axis annotations [For Cartesian plots only].

angle: float | None = None

Angle of the axis annotations.

Examples using pygmt.params.Axis

3-D bar plot

3-D bar plot

Plotting a surface

Plotting a surface

3-D scatter plots

3-D scatter plots

Double Y-axes graph

Double Y-axes graph

Colorbar

Colorbar

Multiple colormaps

Multiple colormaps

Inset

Inset

Inset map showing a rectangular region

Inset map showing a rectangular region

Legend

Legend

Scale bar

Scale bar

Timestamp

Timestamp

Blockmean

Blockmean

Histogram

Histogram

Rose diagram

Rose diagram

Scatter plot with histograms

Scatter plot with histograms

Cross-section along a transect

Cross-section along a transect

Political boundaries

Political boundaries

Highlight country, continent and state polygons

Highlight country, continent and state polygons

Tile maps

Tile maps

Focal mechanisms

Focal mechanisms

2. Create a contour map

2. Create a contour map

Azimuthal equidistant projection

Azimuthal equidistant projection

Perspective projection

Perspective projection

General stereographic projection

General stereographic projection

Gnomonic projection

Gnomonic projection

Lambert azimuthal equal-area projection

Lambert azimuthal equal-area projection

Orthographic projection

Orthographic projection

Albers conic equal-area projection

Albers conic equal-area projection

Equidistant conic projection

Equidistant conic projection

Lambert conic conformal projection

Lambert conic conformal projection

Polyconic projection

Polyconic projection

Cassini cylindrical projection

Cassini cylindrical projection

Cylindrical equal-area projection

Cylindrical equal-area projection

Cylindrical equidistant projection

Cylindrical equidistant projection

Mercator projection

Mercator projection

Miller cylindrical projection

Miller cylindrical projection

Oblique Mercator projection

Oblique Mercator projection

Cylindrical stereographic projection

Cylindrical stereographic projection

Transverse Mercator projection

Transverse Mercator projection

Universal Transverse Mercator projection

Universal Transverse Mercator projection

Eckert IV equal-area projection

Eckert IV equal-area projection

Eckert VI equal-area projection

Eckert VI equal-area projection

Hammer projection

Hammer projection

Mollweide projection

Mollweide projection

Robinson projection

Robinson projection

Sinusoidal projection

Sinusoidal projection

Van der Grinten projection

Van der Grinten projection

Winkel Tripel projection

Winkel Tripel projection

Plotting Earth relief

Plotting Earth relief

Plotting features on a 3-D surface

Plotting features on a 3-D surface

Adding an inset to the figure

Adding an inset to the figure

Plotting vectors

Plotting vectors